The MiWeigh main dashboard provides a comprehensive view of your production metrics, designed to offer actionable insights and facilitate efficient operations. It comprises several intuitive sections:
Filter Section
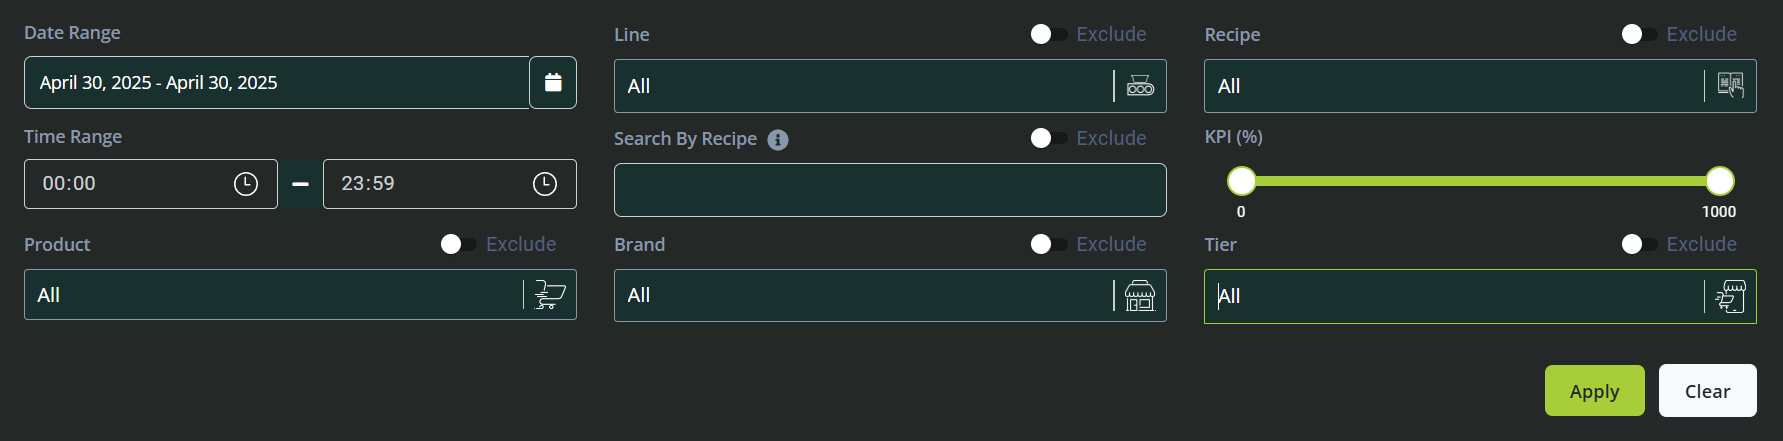
At the top of the dashboard, users can filter data by various parameters:
Date Range: Select specific start and end dates to analyse data within a particular timeframe.
Line: Filter data based on individual production lines or groups of lines.
Recipe: Choose specific recipes to view their production statistics.
Time Range: Refine your analysis by specific hours or shifts within a day.
Search by Recipe: Quickly locate recipes by name to access related data.
KPI: Filter by key performance indicators to assess specific performance criteria.
Product: View data specific to selected products.
Brand: Focus on production data by brand categories.
Tier: Filter results based on product tier classifications.
These filters allow users to customize the dashboard views and analyse data specific to their operational requirements.
Key Metrics and Visualizations
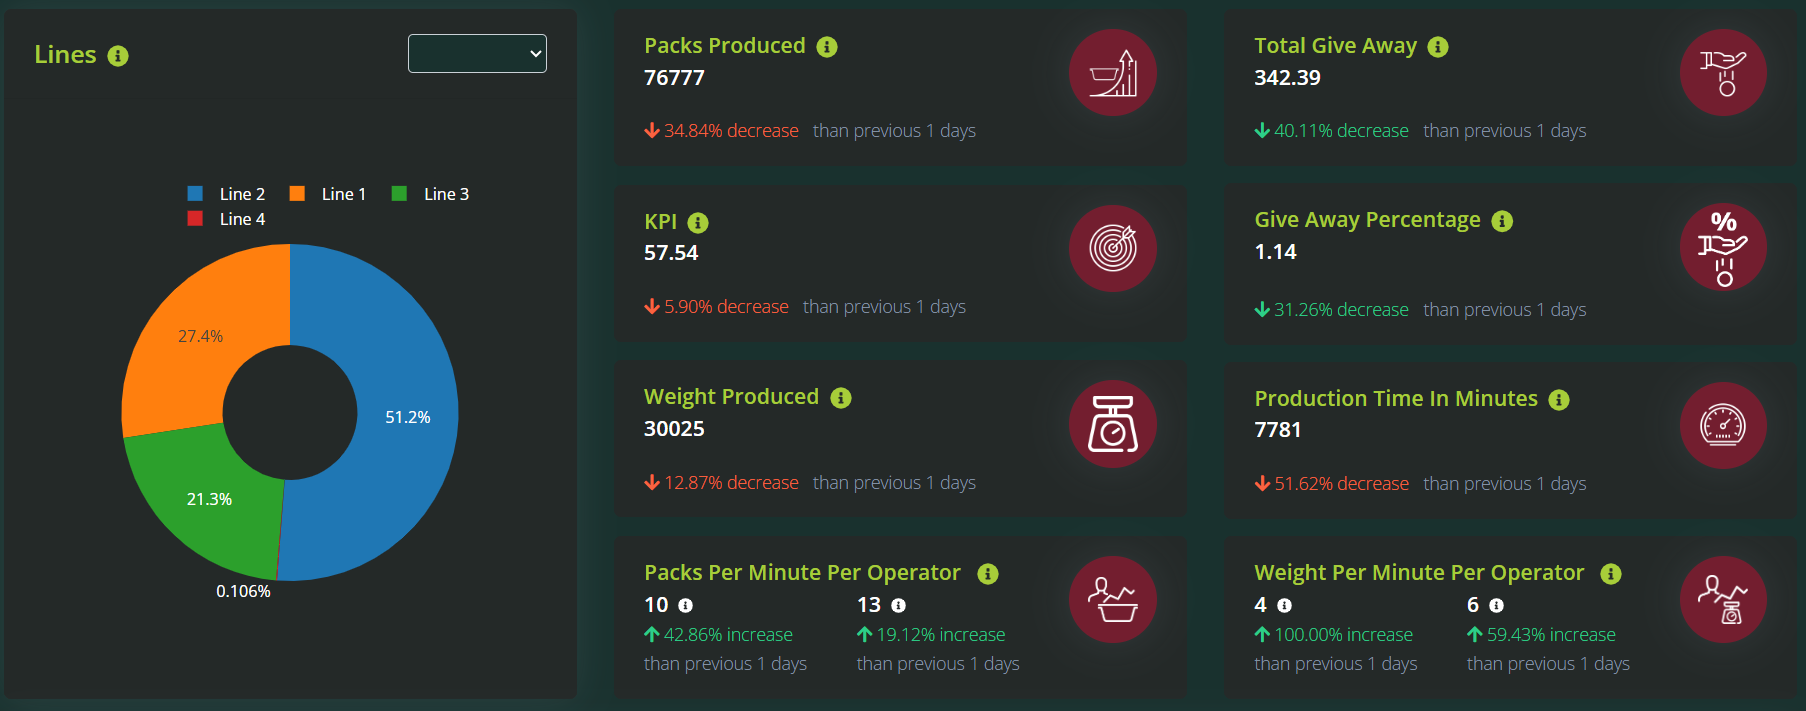
Pie Chart (Lines): A graphical breakdown illustrating the proportion of production attributed to each line.
Packs Produced: Displays the total number of packs completed within the selected timeframe.
KPI: Summarizes performance against set operational benchmarks, highlighting efficiency and productivity.
Weight Produced: Shows the cumulative weight of products processed.
Packs per Minute per Operator: Measures operator productivity by calculating average pack output per minute.
Total Giveaway: Indicates the total amount of product weight exceeding target specifications.
Giveaway Percentage: Presents giveaway as a percentage, enabling better control over material waste and costs.
Production Time (minutes): Tracks total active production minutes, helping identify operational efficiency.
Weight per Minute per Operator: Evaluates operator performance based on the weight of products produced per minute.
Production Data Table
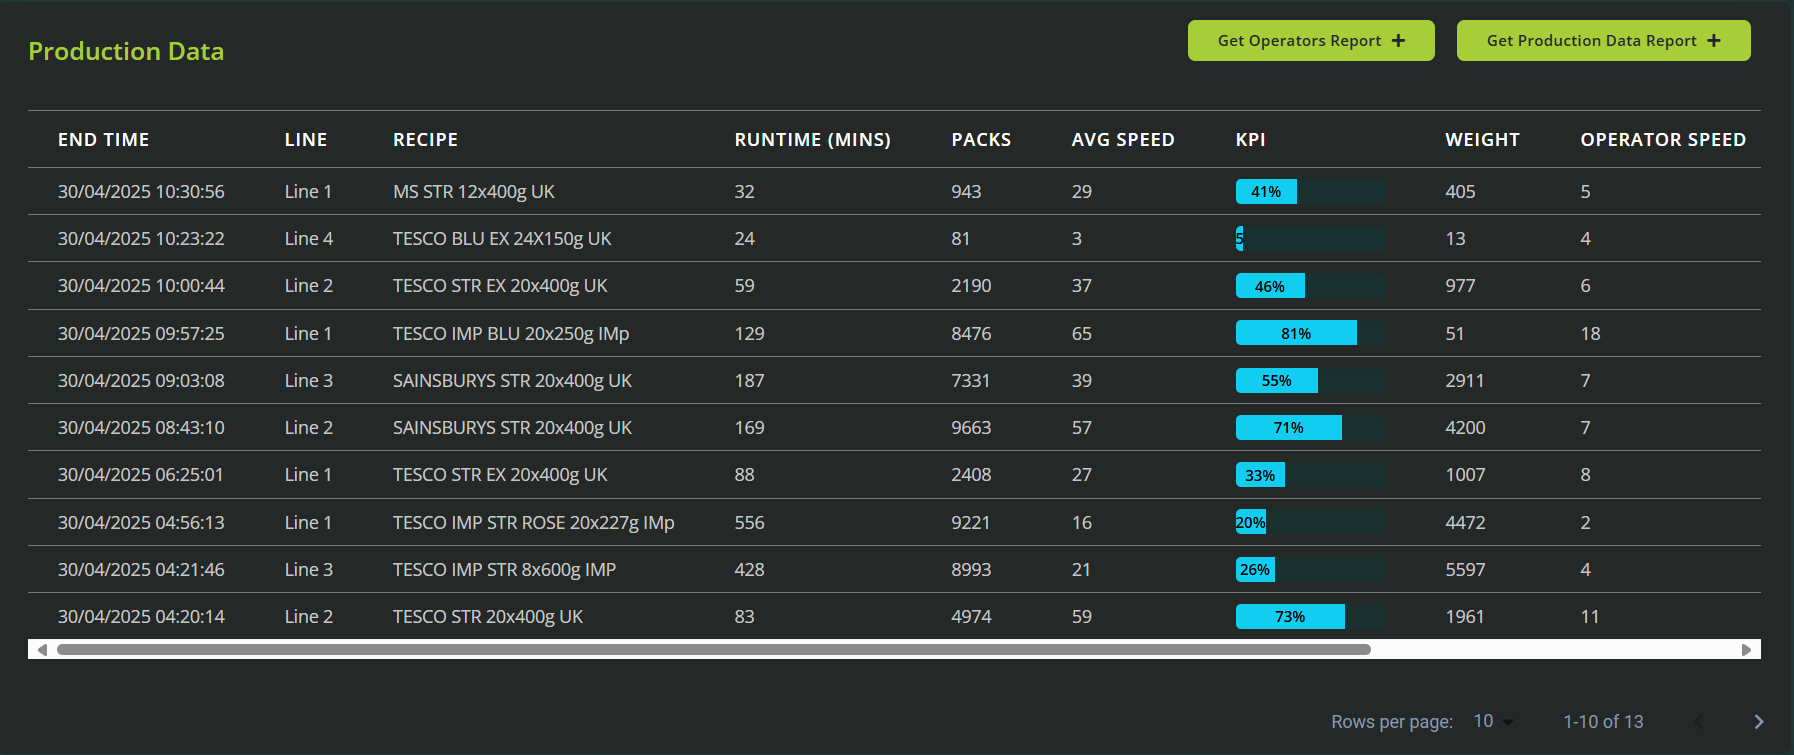
Provides comprehensive details of individual batches, including timestamps, production quantities, and giveaway details. Users can export these data sets into customizable reports for further analysis or archiving.
Analytical Graphs
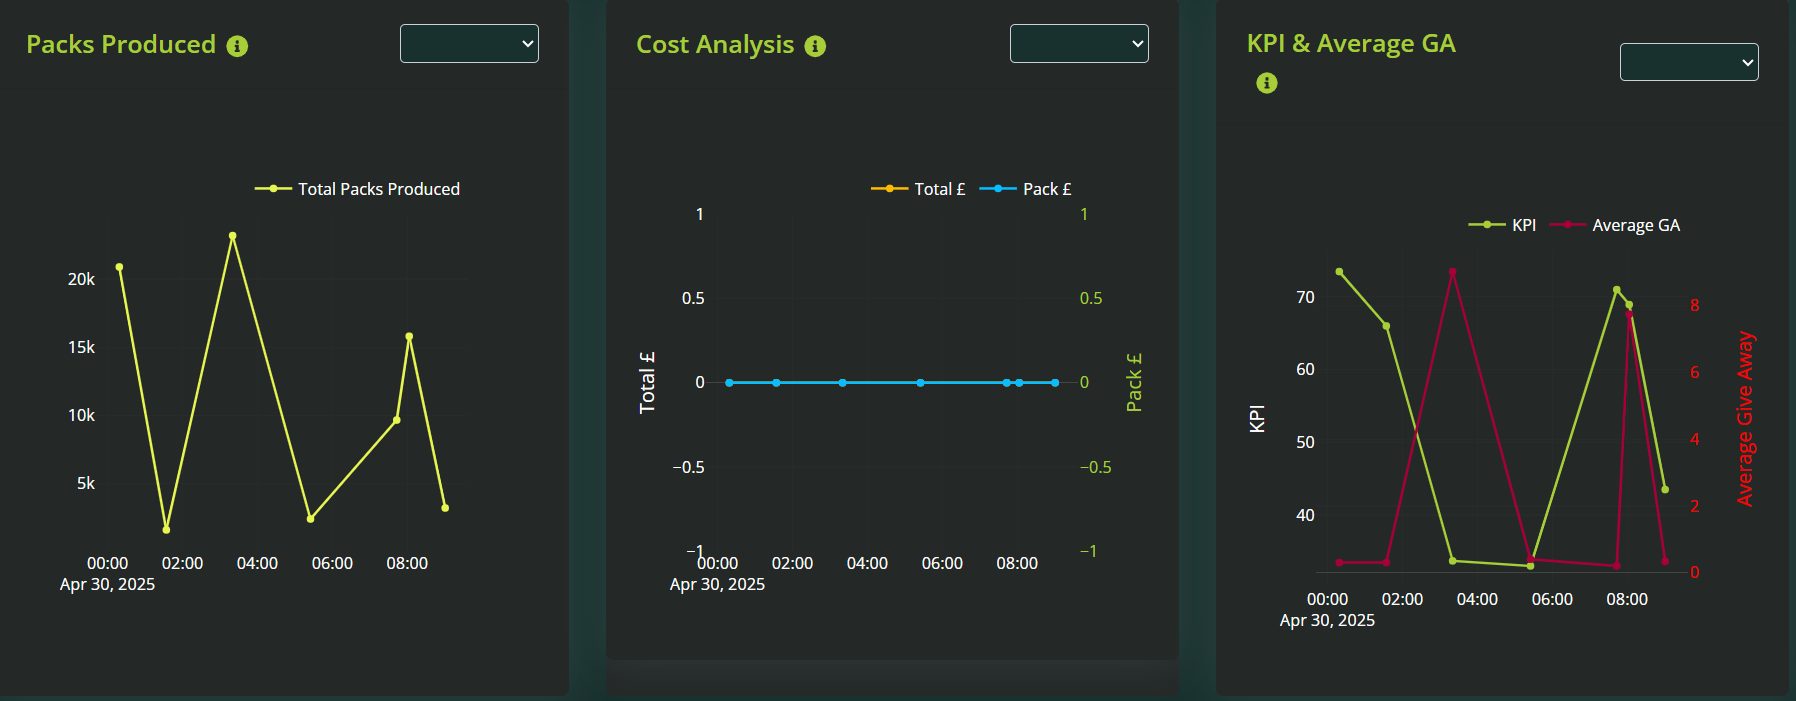
Packs Produced: Visual trends indicating production volumes over specified time periods.
Cost Analysis: Detailed graphical insights into production costs, highlighting areas of potential savings.
KPI & Average Giveaway: Comparative analysis of performance indicators against average giveaway, aiding in optimization strategies.
Recipe Management Table
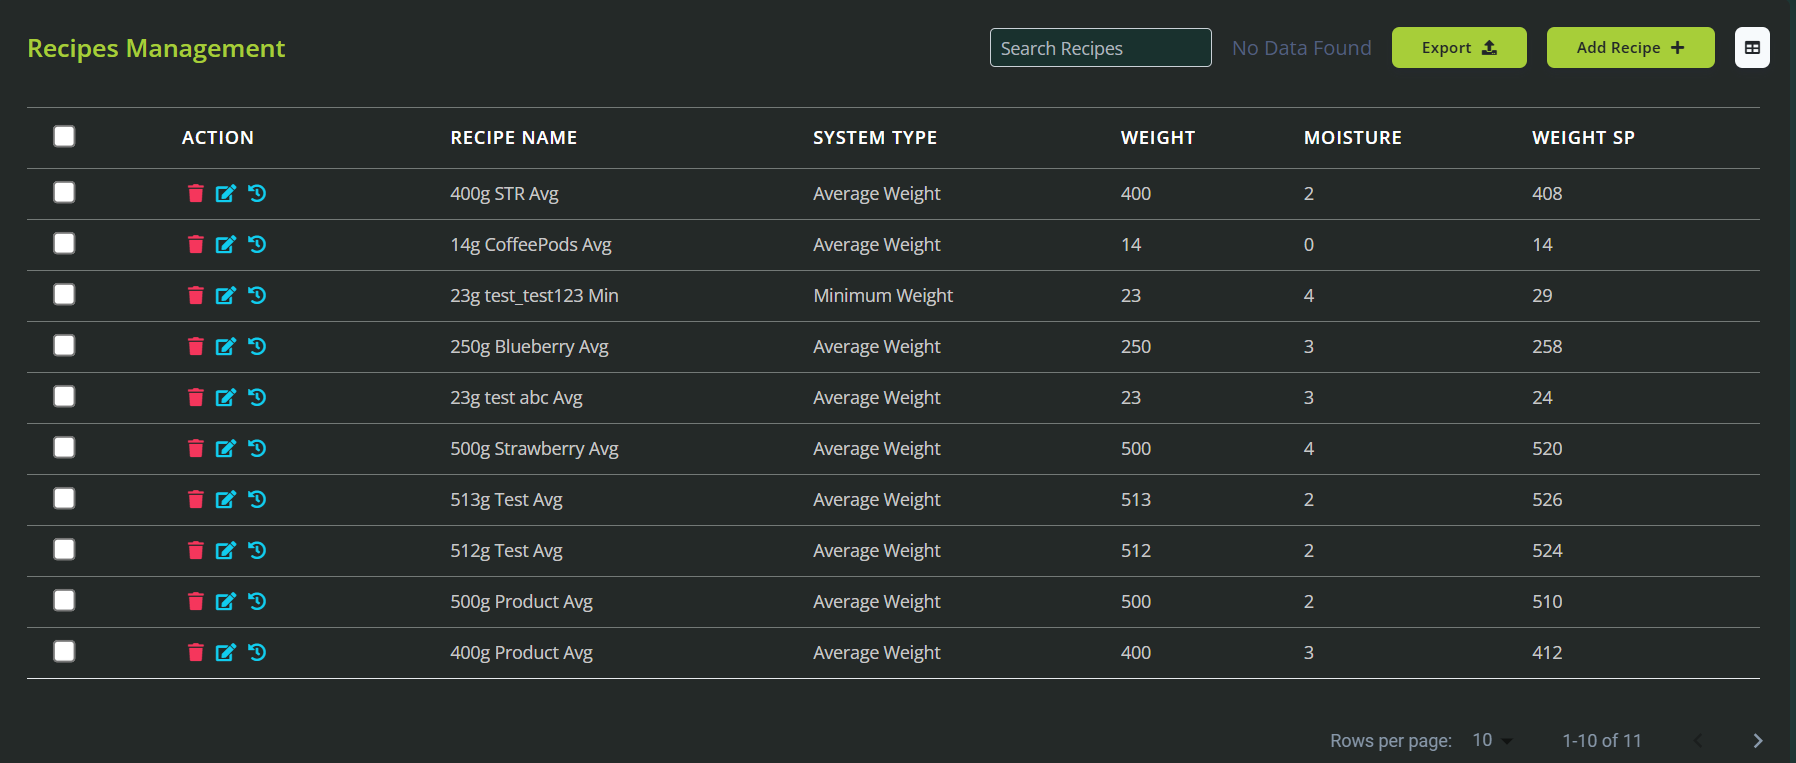
Users can effectively manage and review recipes, create new recipes, apply additional filters for easy navigation, and export selected recipes for record-keeping or further use.
This structured and data-rich dashboard empowers users with comprehensive oversight and precise control over their MiWeigh scale operations.
Was this article helpful?
That’s Great!
Thank you for your feedback
Sorry! We couldn't be helpful
Thank you for your feedback
Feedback sent
We appreciate your effort and will try to fix the article