The Filter Panel at the top of the MiWeigh Dashboard allows users to refine batch data based on selected criteria. This helps teams analyse production performance, investigate issues, and prepare accurate reports.
All filters update the dashboard in real time, affecting metrics, charts, and tables throughout the page. Each filter also includes an “Exclude” option to remove selected values instead of including them.
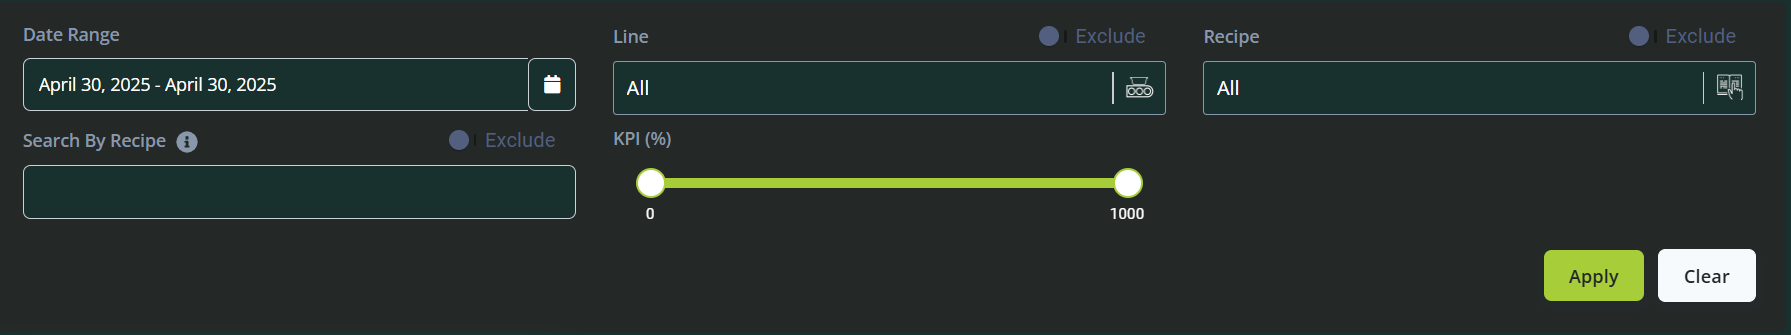
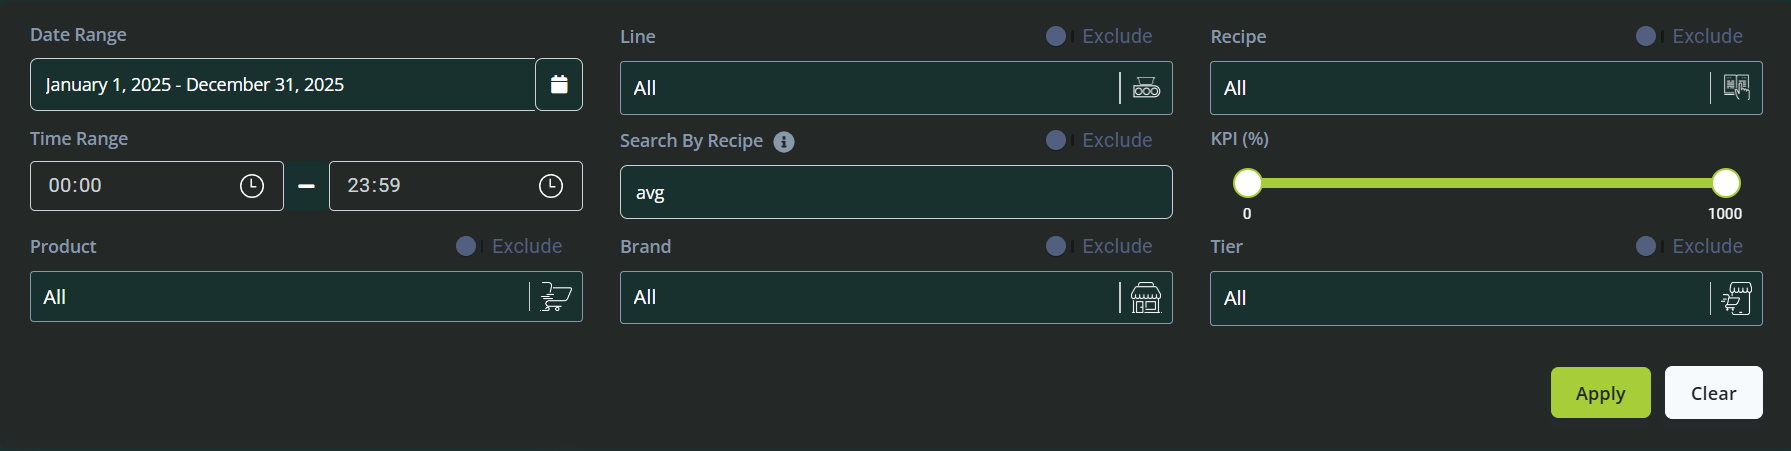
Premium customers will have more available options to filter the data such as Brand, Tier and Product. The variable for these filter options must be created under Recipe Management.
Available Filters
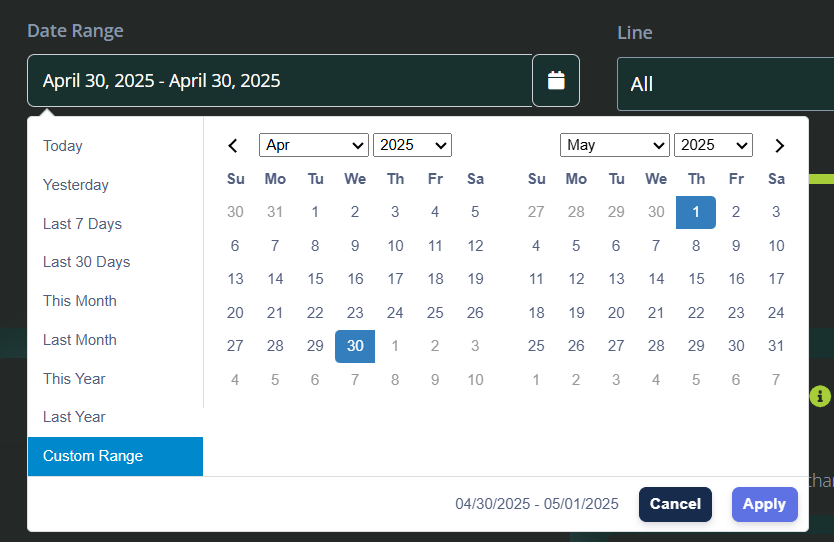
Date Range
Allows you to define a custom start and end date to limit the data shown across all dashboard components. This filter is essential for period-based reporting, trend analysis, or isolating events on specific days.
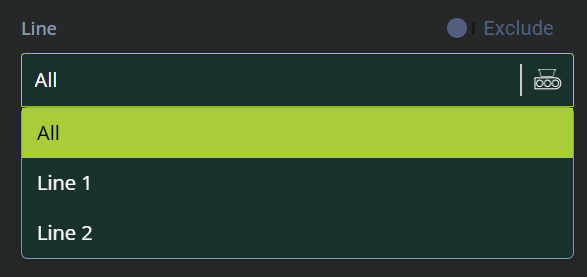
Line
Lets you filter data by one or more production lines. This is useful for reviewing specific equipment performance, comparing lines, or excluding lines that were inactive or under maintenance.
Example: Select “Line 1” to view its output, giveaway, and efficiency across the selected date range.
Use the Exclude option to remove a line from the data view.
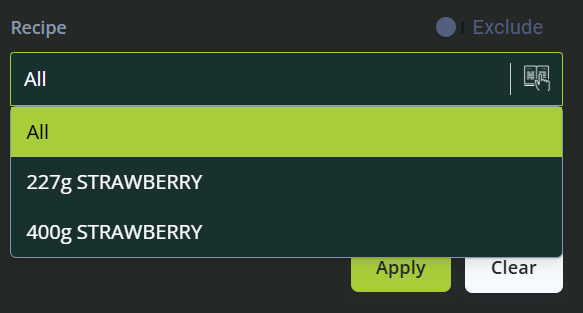
Recipe
Allows filtering by recipe name. Each batch in the system is tied to a recipe, and this filter enables analysis of performance, weight, and production KPIs tied to specific recipes.
Use the dropdown to select one or more recipes.
Combine with Date Range to evaluate recipe trends over time.
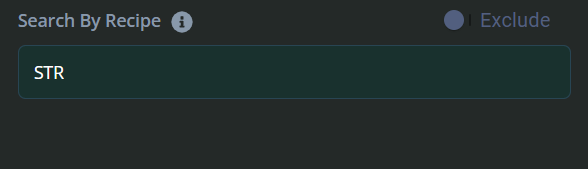
Search by Recipe
A fast search input that allows users to locate a recipe by typing all or part of its name, including parameters embedded within the recipe name. This is especially helpful in systems with a large number of recipes.
You can search using keywords such as "STR", "400g", or any other relevant identifiers that are part of the recipe name.
Once you've entered your search term, click "Apply" to filter the dataset. Only batches tied to the searched recipe will be displayed after applying the filter.
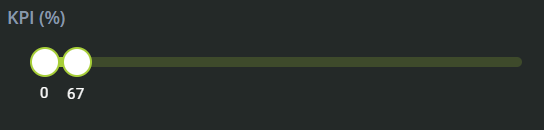
KPI
This filter allows users to focus the dataset on a specific Key Performance Indicator. Depending on the dashboard setup, this may include:
Giveaway %
Overfill or Underfill %
Efficiency or Performance Metrics
Selecting a KPI will prioritise or highlight this metric across charts and tables, enabling focused analysis.
✅ Example Use Cases
Below are some common scenarios that illustrate how to use these filters for practical analysis:
1. View all batch data from Line 2 in the past week
Filters:
Date Range: Last 7 days
Line: Line 2
Result: Dashboard displays metrics, graphs, and tables specifically for Line 2's performance during the selected period.
2. Identify high-giveaway recipes
Filters:
KPI: Giveaway %
Date Range: Current month
Result: KPI graphs and the Production Data table highlight recipes with the highest giveaway trends.
3. Search for a specific recipe tied to a customer query
Filters:
Search by Recipe: Enter part or full recipe name
Date Range: Date of customer complaint
Result: Instantly locate and analyse performance metrics for the recipe in question.
4. Exclude a known issue line from monthly reporting
Filters:
Line: Select the faulty line
Exclude: ✅
Date Range: Full month
Result: The dashboard updates to reflect only relevant and valid production data.
5. Compare performance between two recipes
Filters:
Recipe: Select Recipe A and Recipe B
Date Range: Past month
Result: Side-by-side KPI metrics and visual comparisons help assess recipe-level efficiency or cost.
Was this article helpful?
That’s Great!
Thank you for your feedback
Sorry! We couldn't be helpful
Thank you for your feedback
Feedback sent
We appreciate your effort and will try to fix the article