The Current Status page provides a real-time overview of the performance and activity across all weigh systems and production lines. It is designed to give production teams immediate visibility of system health, line activity, batch progress, and operator performance.
What This Page Shows
The page is broken down into key sections that help monitor current operations:
✅ Line Status Indicators
At the top of the page, each weigh system/line is listed with a live status indicator.
Online / Active – The line is currently connected and operational.
Offline / Inactive – No live data is being received from the line.
These statuses help quickly identify if any lines are experiencing downtime or connectivity issues.
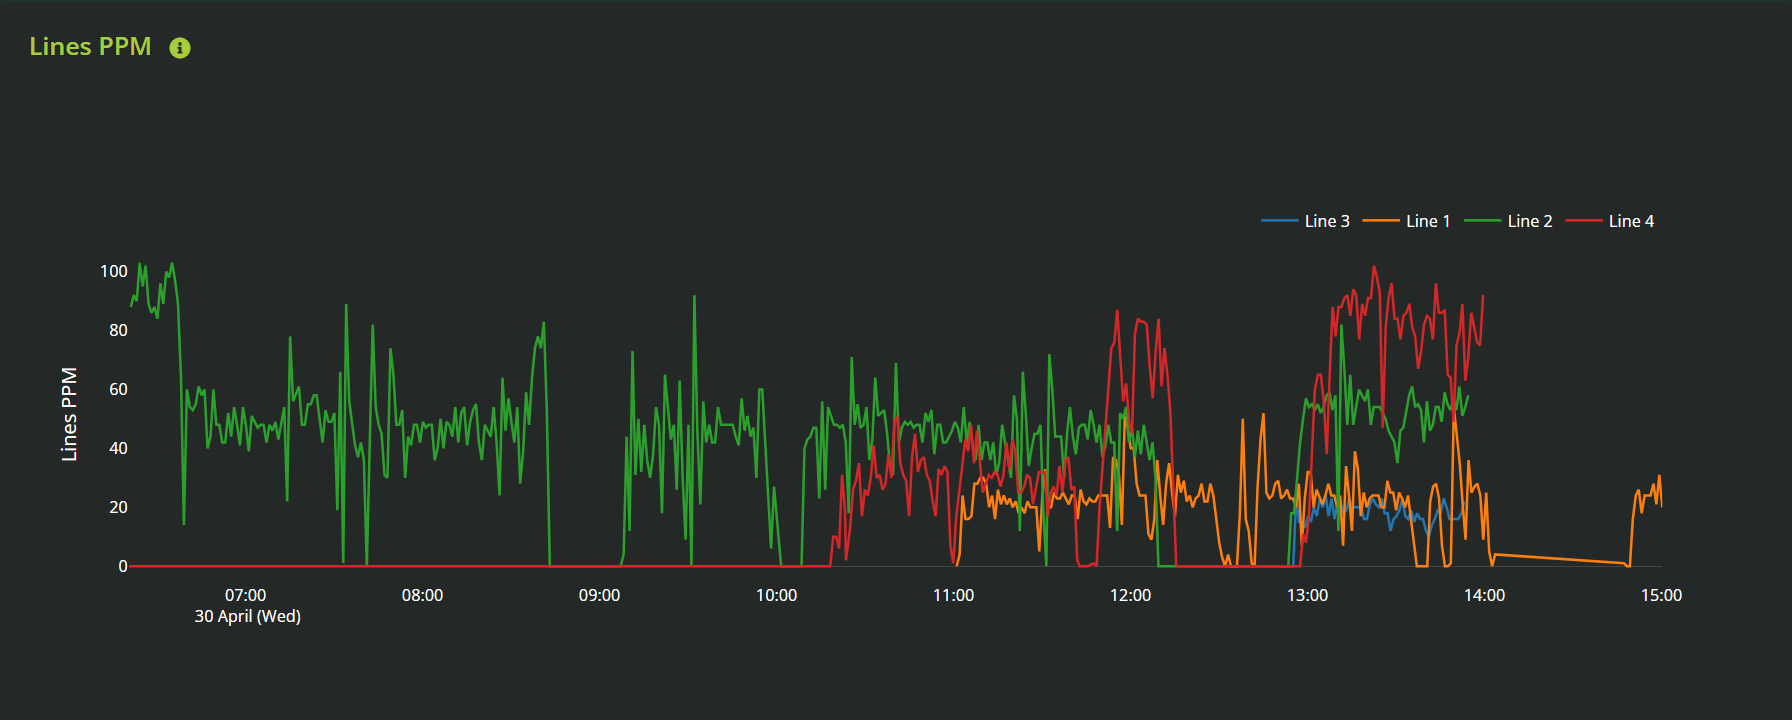
Line Graph – Average Packs Per Minute (PPM)
A real-time line graph displays the average Packs Per Minute across all active lines.
Each line is represented with a unique colour.
This graph helps identify:
Which lines are producing efficiently.
Any sudden drops or spikes in throughput.
Trends across shifts or time periods (if viewed over time).
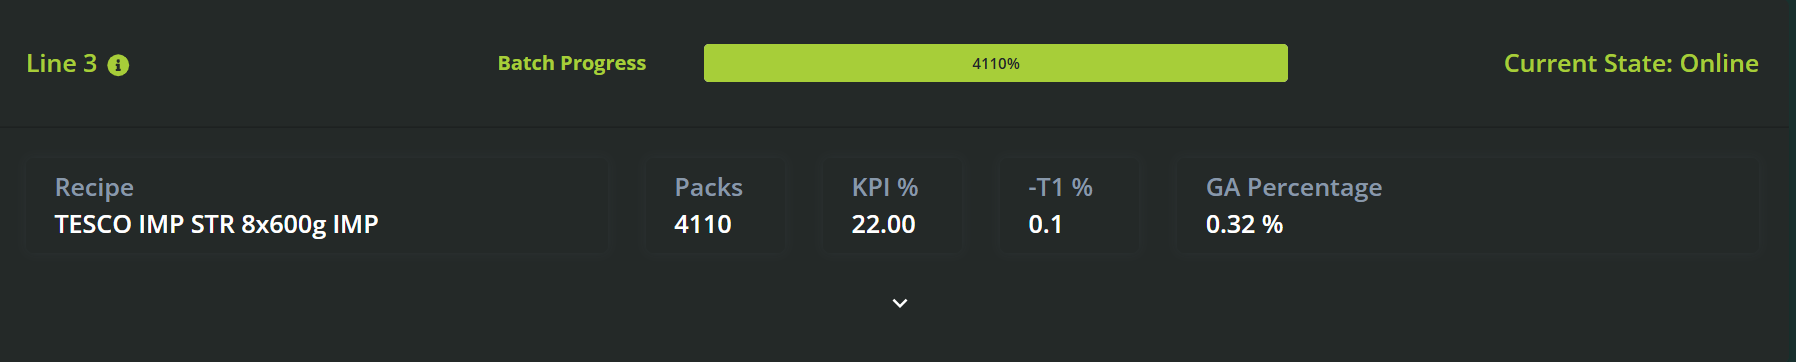
Batch-Level Detail Per Line
Below the graph, each production line is displayed with its current batch progress and performance metrics.
For each line, the following data is shown:
Recipe Name – The recipe currently running on the line.
Batch Progress – Progress bar or % indicator showing how far along the current batch is.
KPI – Key Performance Indicator (e.g., efficiency, weight accuracy).
Packs – Number of packs produced in the current batch.
Giveaway % – Percentage of excess weight being produced beyond target specification.
This section allows supervisors to compare batch performance in real time and spot any inefficiencies quickly.
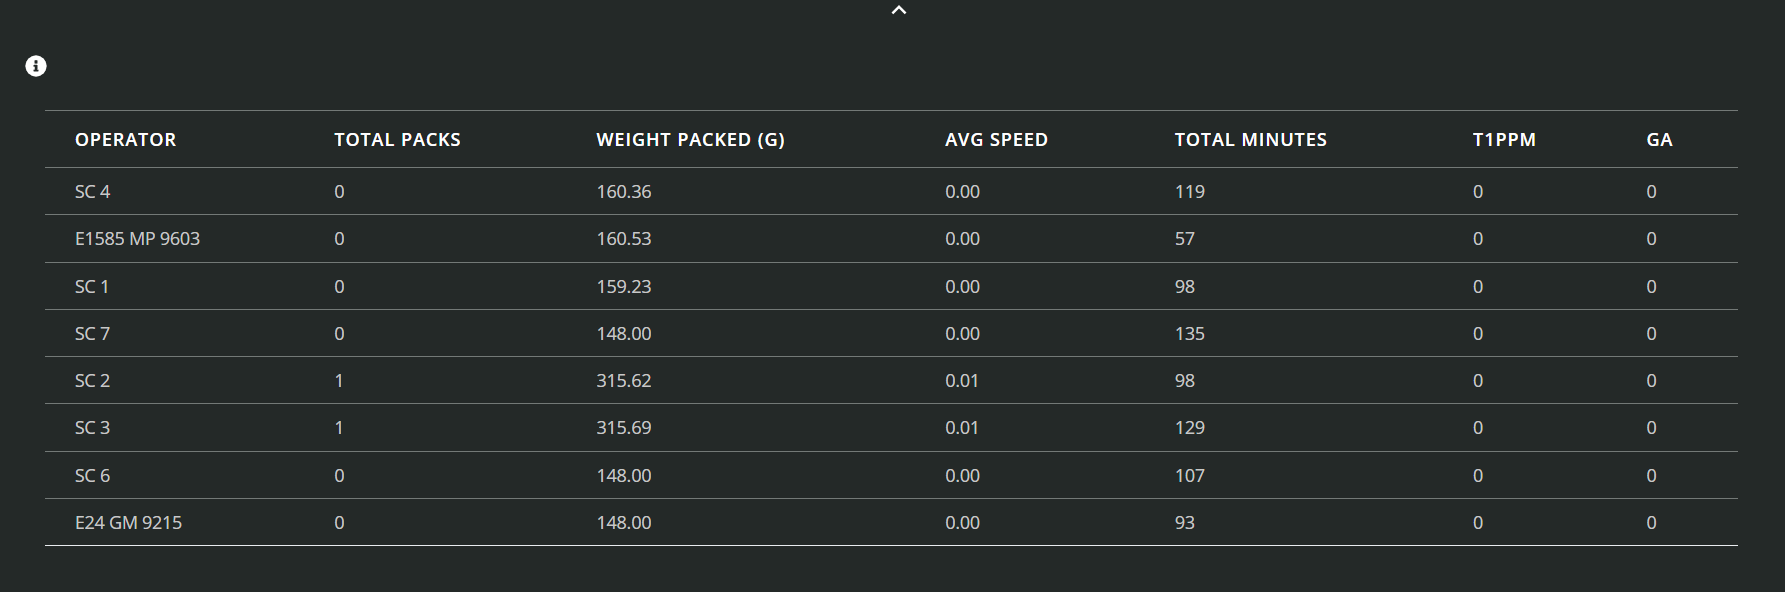
Operator Performance Table
At the bottom of the page, a detailed table lists all active operators and their individual performance metrics.
Each row typically includes:
Operator Name
Assigned Line
Packs Per Minute (PPM)
Giveaway %
Runtime
Batch Involvement (if applicable)
This view supports shift leaders and production managers in identifying:
High-performing operators
Operators who may need support or coaching
Line-to-operator efficiency correlations
✅ How to Use the Current Status Page
Check line status indicators at the top to ensure all systems are online.
Review the PPM graph to identify underperforming lines or trends in throughput.
Drill into batch progress per line to monitor recipe performance and giveaway levels in real time.
Use the operator table to track shift-level performance and address issues early.
Example Use Cases
Identify underperforming lines mid-shift by checking the average PPM graph.
Confirm batch progress and ensure current recipes are on track to complete in time.
Spot high giveaway on a specific line before it causes major product loss.
Track which operators are achieving the best efficiency and lowest giveaway for recognition or review.
Monitor system connectivity across all lines to catch any data outages early.
Was this article helpful?
That’s Great!
Thank you for your feedback
Sorry! We couldn't be helpful
Thank you for your feedback
Feedback sent
We appreciate your effort and will try to fix the article